Selective Cuttings
The current state of forest industry recovery
April 1, 2014
It is commonly accepted among Canadian forest industry stakeholders that an industry “crisis” began in the mid-2000s, which deepened through the global recession, and out of which the industry has started to recover. This recovery has been driven by a number of forces, including industry efforts to cut costs and rationalize capacity, slow (but steady) growth in global demand, and the industry transformation agenda (supported by industry, government and other stakeholders). With a new year now well underway, it is worth taking stock of how close to “fully recovered” the industry is.
Of course, various subsectors and stakeholders will define recovery according to different metrics. In the interest of breadth, ten metrics have been chosen: return on capital employed (ROCE), operating profit, and then for both wood and pulp & paper manufacturing: employment, real GDP, export value, and rail shipments.
Complicating this somewhat is the fact that different subsectors experienced the crisis at different times. An ideal measure of recovery includes two pieces of information: 1) how much we have grown since the trough (how far have we come?), and 2) how far we have to go until we return to normal (are we there yet?). For the purposes of this analysis, then, we take the difference between the Q3-2013 value for each metric and the minimum value that metric achieved since Q1-2001 (how far have we come?) and divide it by the difference between the average value for each metric since Q1:2001 and the minimum value for that period (are we there yet?). That is, we have expressed the amount the industry has grown since hitting rock bottom as a percentage of how far below normal conditions rock bottom was. For most metrics, one would reasonably define “full recovery” as a 100% value.
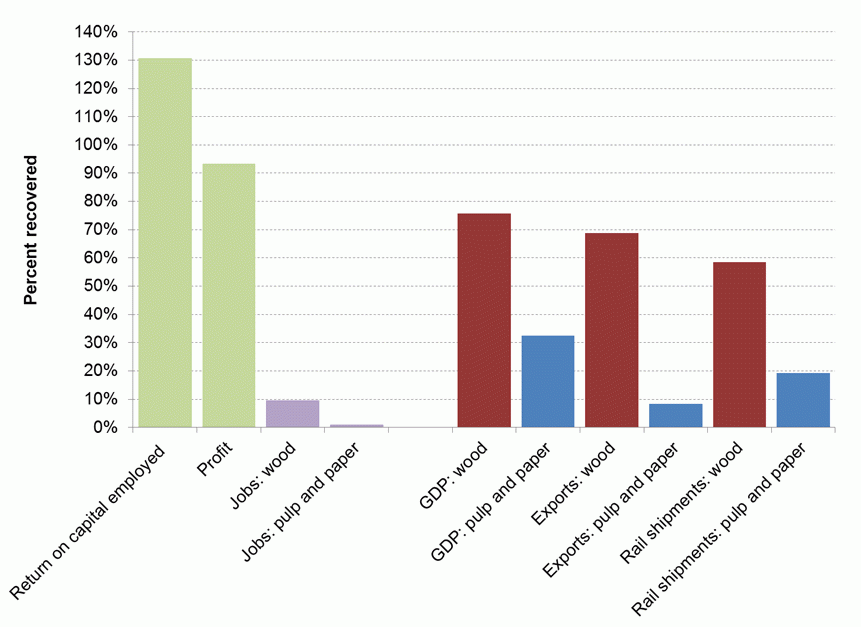
State of recovery of the Canadian forest sector as of Q3 2013 according to selected metrics
The data in the figure comform largely to three distinct sets of expectations. First, consider the four metrics on the left of the x-axis (ROCE, profit, and jobs in wood and P&P). Return on Capital Employed (ROCE) and profits have recovered much stronger than jobs. This is typical of most recoveries, where management makes sure that current facilities are making good profits before increasing employment. Management decisions in private industry are generally made to maximize the risk-adjusted return on capital, which results in recovery of returns for owners of capital (typically shareholders or private owners) earlier than increases in labour. As a result, it is not surprising that forest industry ROCE has fully recovered from the crisis, and indeed has surpassed its long-term average level, even though employment still has a significant ways to go. Which is to say, in an industry under pressure to control costs, labour is not only a means of production, but also one of the largest costs. As such, the recovery has proceeded first through limiting labour cost growth in order to maintain investment by demonstrating adequate returns on capital. One would expect that, as demand continues to recover and production increases, that employment will begin to increase accordingly as a necessary factor of production.
Second, note that though ROCE has fully recovered, operating profits have not. Total production (see the shipments values on the right-side of the x-axis) is far from fully recovered, so in the absence of extremely large increases in price levels (which has not occurred) while fully controlling costs, profits must necessarily be lower than in the past—even though ROCE is higher. At this point we can see the “leaner and meaner” effect: to date, the Canadian forest industry is smaller as it emerges from the crisis, but is generating higher returns to capital.
Third, consider the right-hand side metrics. Across all of them (GDP, exports and shipments), wood manufactures are closer to recovery (58-76%) than pulp and paper manufactures (8-32%). This is unsurprising, as demand for all wood products are increasing due to continued expansion in China and on-going U.S. housing market recovery, while demand for several key paper products (such as newsprint and other graphic papers) continues to decline. Increased demand for some pulp and paper products (such as chemical pulps, tissues and packaging) has enabled some recovery in the overall pulp and paper sector, but their recovery has largely been offset by the declining subsectors.
Overall, from the perspective of capital, returns and profits are close if not fully recovered. From the perspective of wood manufactures, recovery is strong but still has a ways to go. From the perspective of pulp and paper manufactures, recovery has been limited. Moving into 2014 one can reasonably expect both wood manufactures and employment to improve as U.S. demand continues to recover, though the outlook is less positive for pulp and paper.

